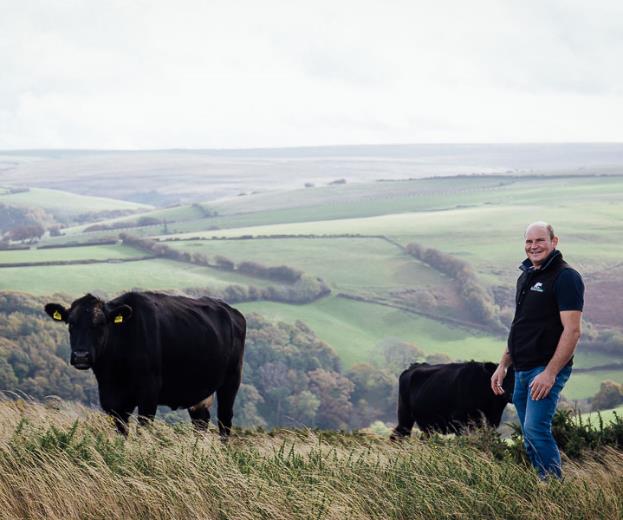
Pensipple Farm is our 200 acre mixed, family farm in South East Cornwall which has been in the family for 84 years. We have a small flock of NZ Romney sheep, grow winter wheat and spring oats with herbal leys and currently winter bird food in the rotation, as part of a substantial Countryside Stewardship and SFI agreement.
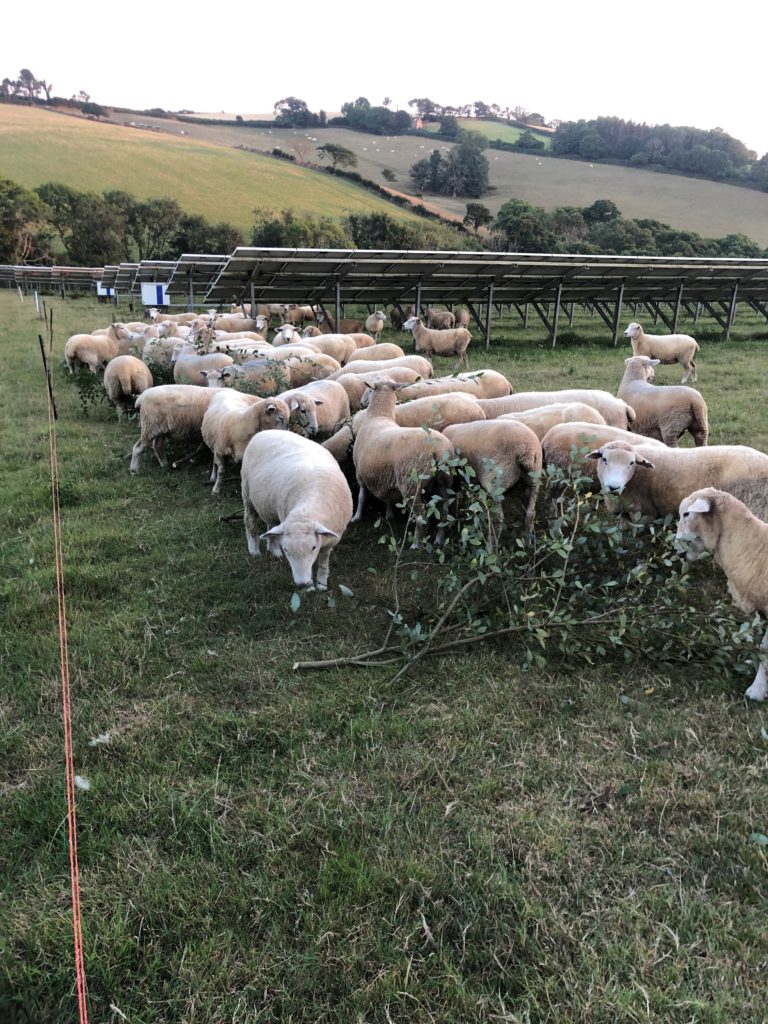
10 years ago, my father and uncle entered an agreement with a solar company and 37 acres of solar panels were installed on the farm. In the decade that followed, parts of the farm which became less accessible due to the solar farm perimeter fence started to sprout willows along the 650m fence line. As they grew higher the solar company asked if they could be managed so they didn’t shade the panels out.
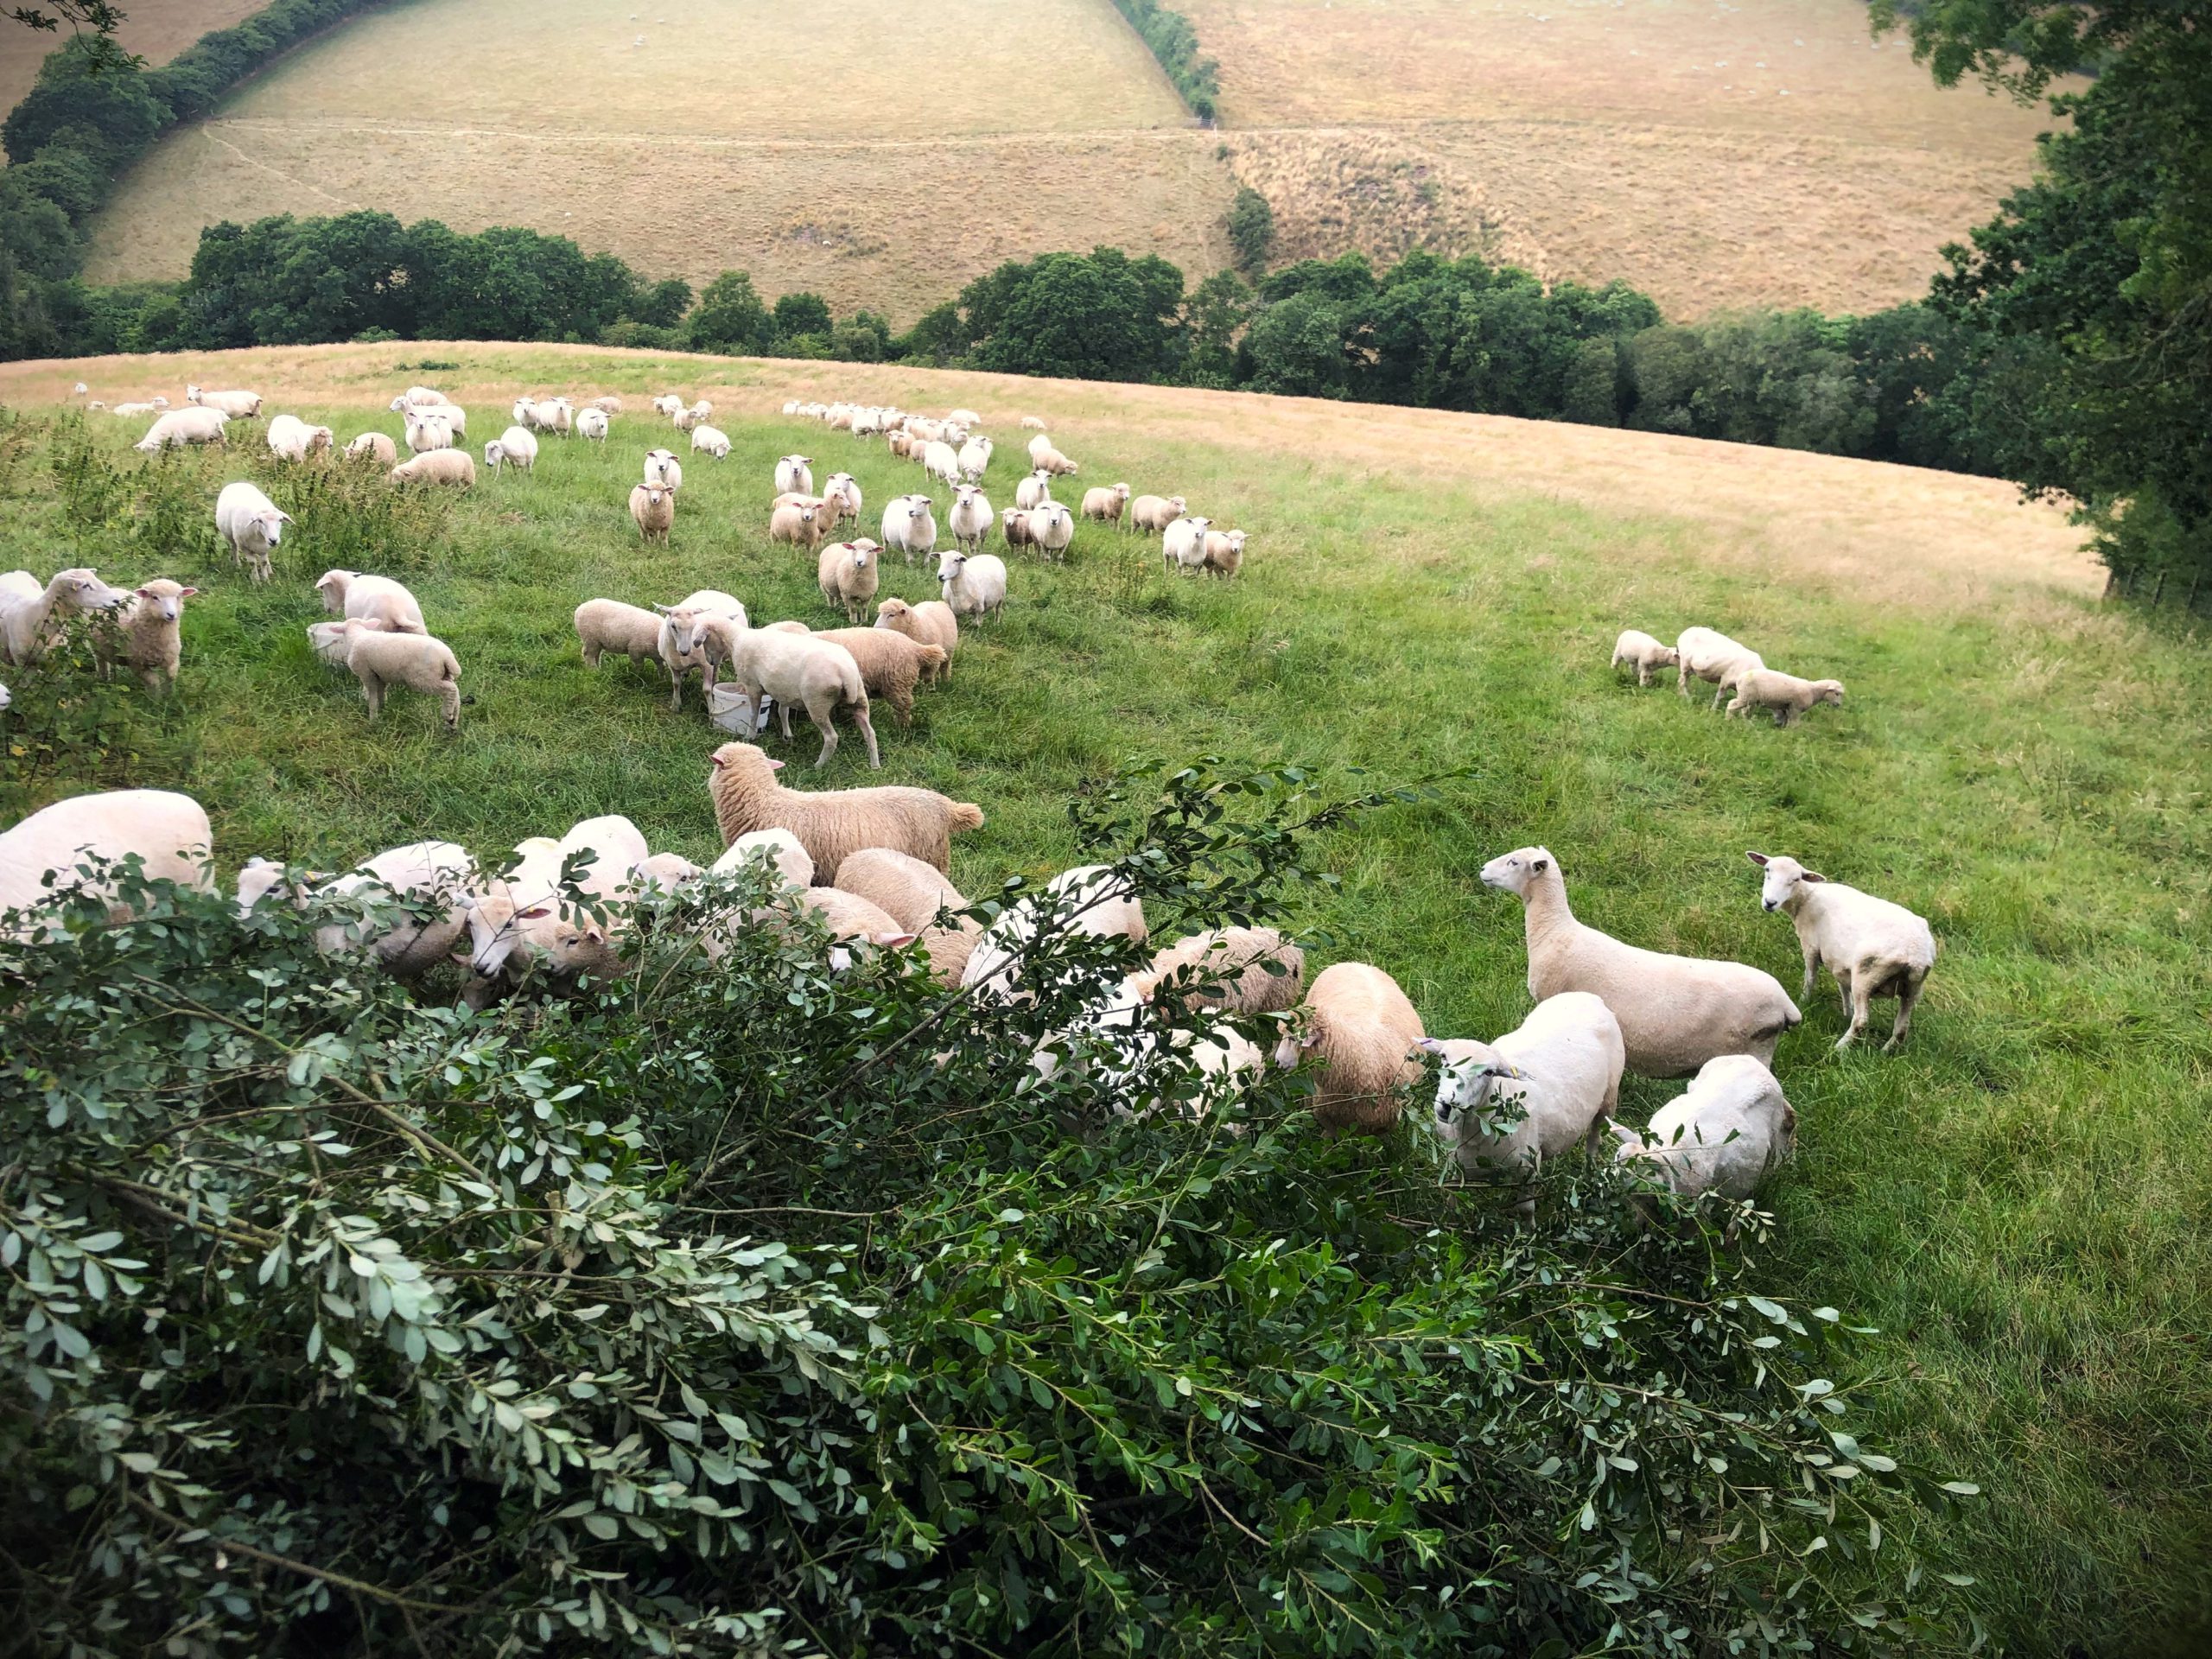
Having read about the positive benefits of willow as a forage source I decided to see what would happen if I coppiced the tall growth and threw it in for the sheep. The result has been dramatic – the sheep absolutely loved it! I now pollard, rather than coppice, the fence line in a 3-4 year rotation all year round – carefully checking for nesting birds. The branches are thrown in for the sheep to browse, and allow them to graze the lower branches as they rotate through this part of the farm.
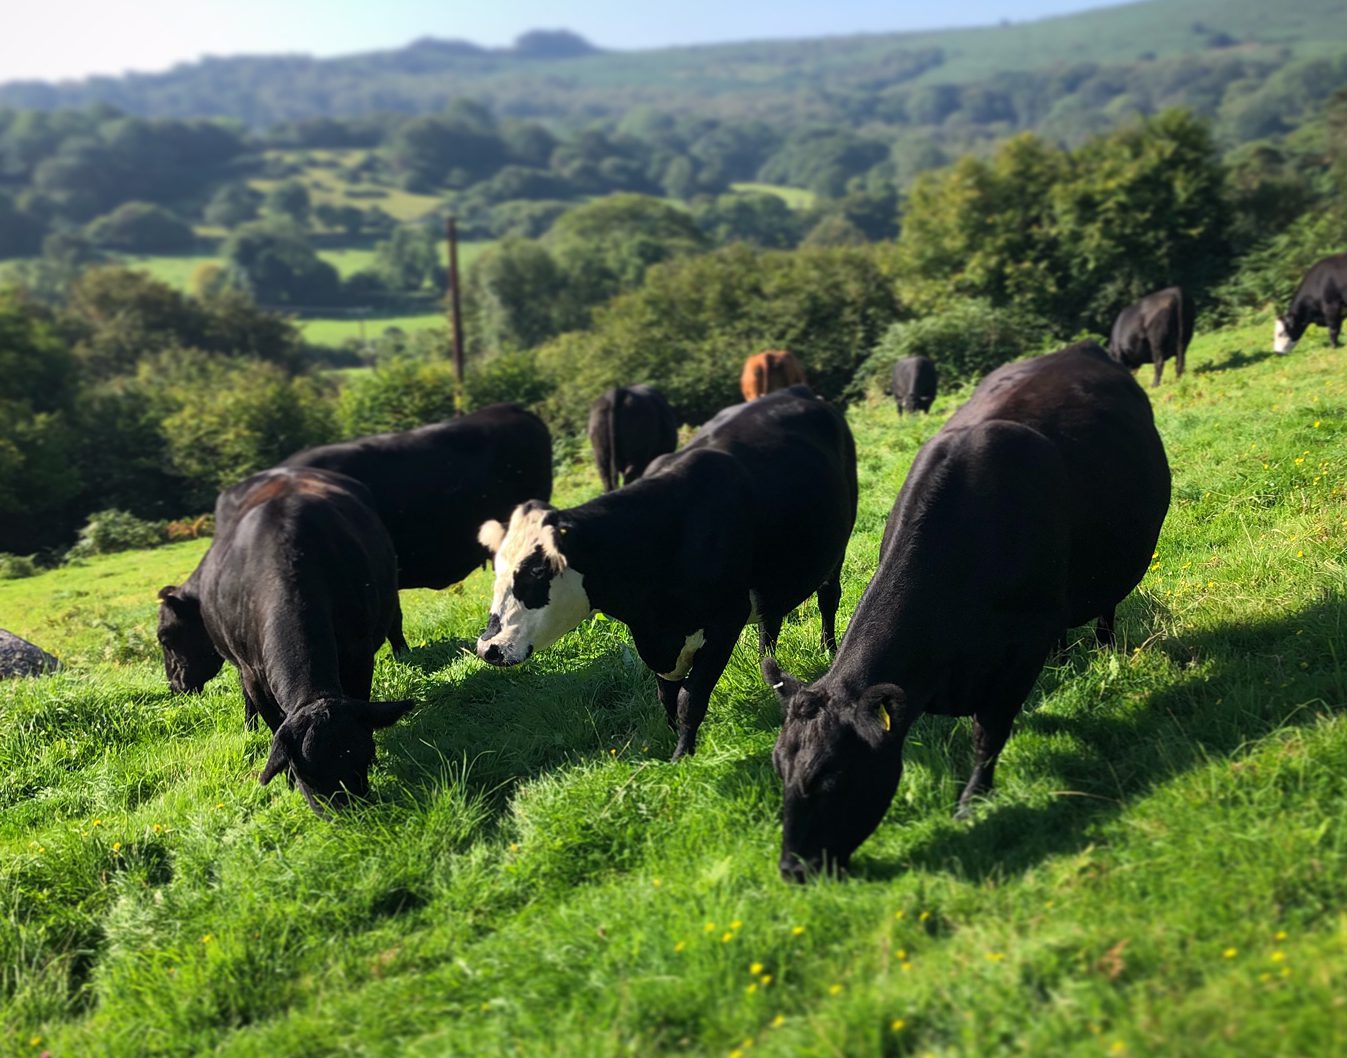
Sheep grazing on freshly cut willow at Pensipple Farm
Sheep eating willow
The majority is Grey WIllow and is self seeded, although I have planted more saplings this winter in other parts of the farm where the sheep graze.
The leaves contain good levels of Zinc and Cobalt, both of which are important for animal health but, cobalt in particular is very important for growing lambs. The bark contains salicin which is a precursor that allows the body to produce salicylic acid, a natural form of Asperine which has anti-inflammatory and pain relieving properties, and has been used for centuries for just this purpose.
I try, but don’t always succeed, in giving them fresh growth to browse two or three times a week from May to October; they will eat leaves and bark. Observing which parts of the plant they are eating can give clues as to their health and what they are looking for. If there is excessive stripping of the bark, this can suggest that some individuals might be looking for pain relief for example, and we can focus our checks accordingly.
The joy of willow is that pretty much all grazing livestock can eat it and, if we observe livestock entering a new field, we often see them move to the hedge rows to seek it out, among other trees and herbs. This suggests there is an innate understanding of what their bodies need and where they can find it in the landscape.
Wider benefits
Apart from the feed benefits of willow, it can also provide shade in summer and shelter in winter, potentially stretching the grazing season and increasing DMI on hotter days. On top of this, strategic planting of willow can reduce flood risk, provide a habitat for birds and insects, as well as increase soil health and sequester above and below ground carbon in significant quantities. Willow coppice has been shown to sequester 16.33 tonnes of CO2e/ha/yr (source: Farm Carbon Calculator).
In the future, I’d like to look into chipping the remnants of the grazed branches and compost them, or extract the growth promoting compounds from them to produce a soil drench or foliar feed. The possibilities are quite exciting!
In my role as a farm carbon and soils project assistant, I get out and about on farms a fair amount. Both at work and at home, this past month has seen me hide in the shade, reach for ice in my drinks and ‘require’ ice-cream…
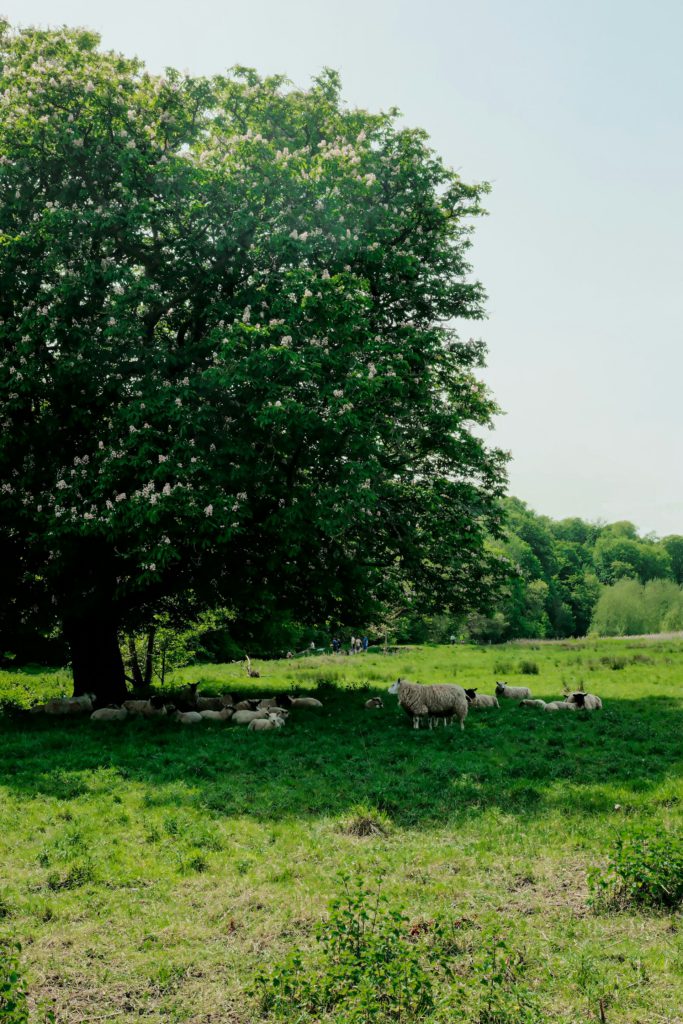
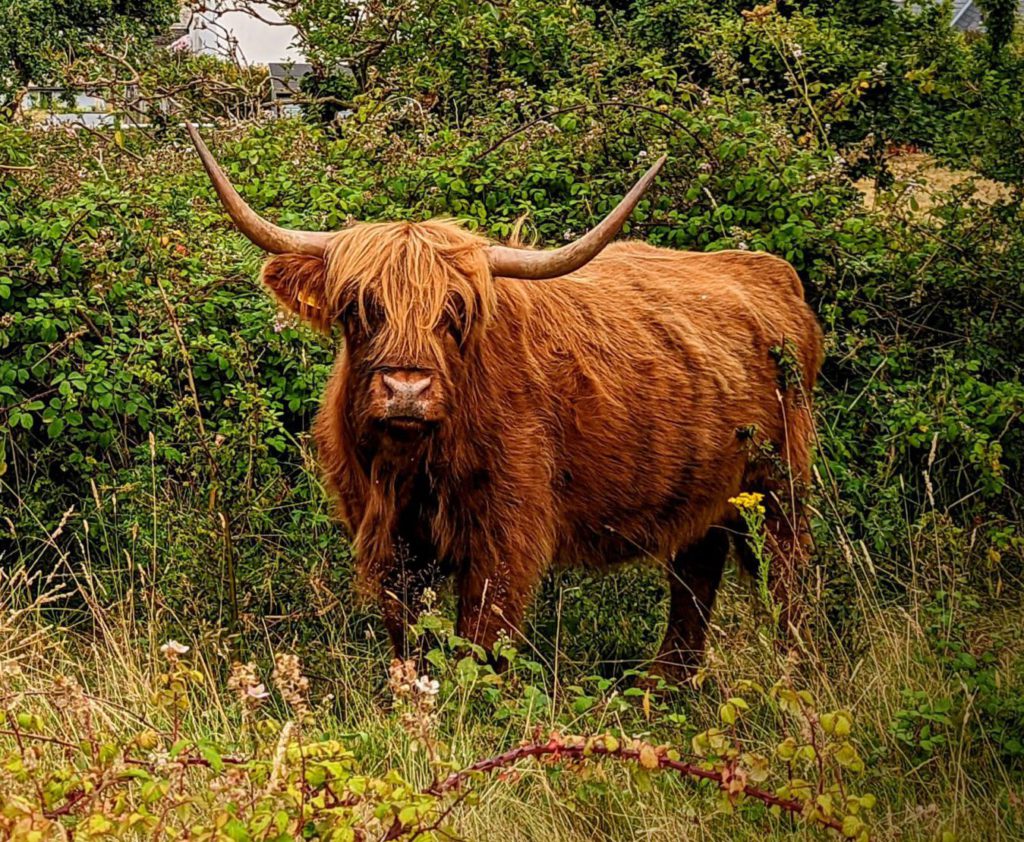
Everywhere I have been, I have seen animals doing their best to find shade.
They do not have the luxury of opening doors and hiding inside, getting ice for their water, or enjoying the soothing cool of melting ice-cream on the tongue – for many, the best they can find is a hedge.
Don’t get me wrong, I’m a major fan of hedges (plant more, please) but when the sun is high in the sky, at its hottest, when the rest of us are re-applying sunscreen, or, if you’re in sunny Europe, taking a siesta, a hedge alone doesn’t actually provide much shade.
The future could be hot
With the Met Office predicting a 50:50 chance of the UK experiencing 40℃ again within the next 12 years (experienced in Lincolnshire in July 2022), for the sake of farmed animals everywhere, we must bring trees back into our farms.
Heat impacts on animals
A quick search on Google Scholar will pull up data showing that heat-stressed animals reduce their feed intake, gain less weight, produce less milk, experience reduced fertility and are more susceptible to ill health. Prolonged exposure to temperatures as low as 22℃ can induce these stresses in cattle.
I’m yet to meet a farmer who doesn’t love her/ his stock and wants to take the best care of them. Everyone wants to see good animal welfare. Increasingly, for the sake of the health and welfare of our animals (not to mention the myriad other benefits they can provide including carbon storage, alternative income streams, biodiversity gain, etc.), we need to get more trees into our farm systems.
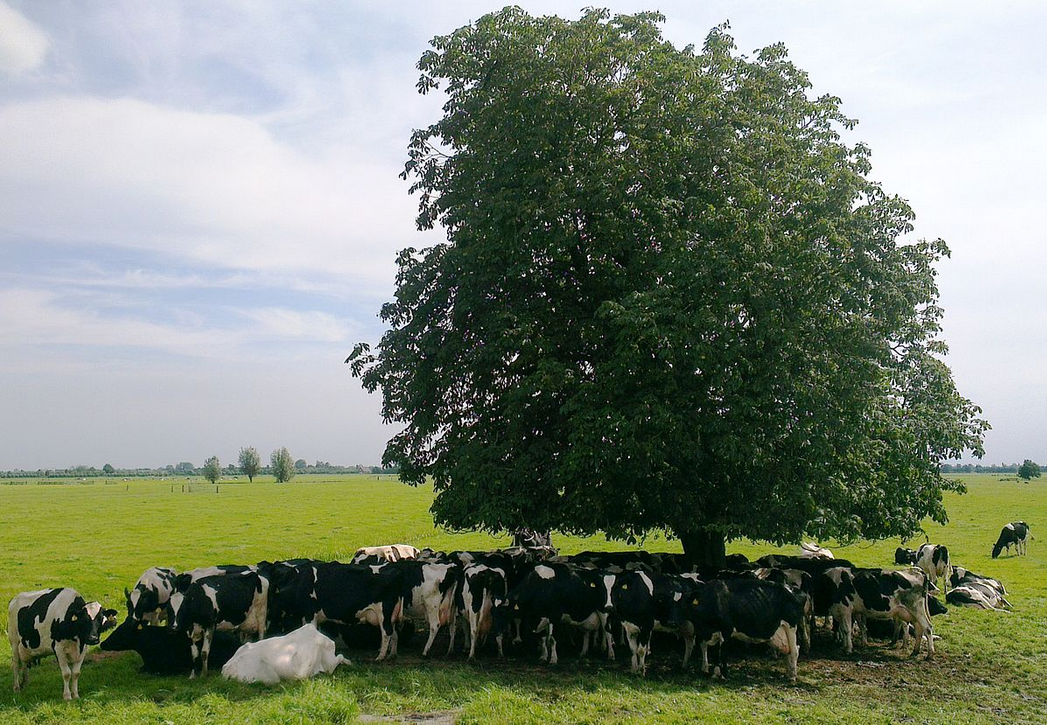
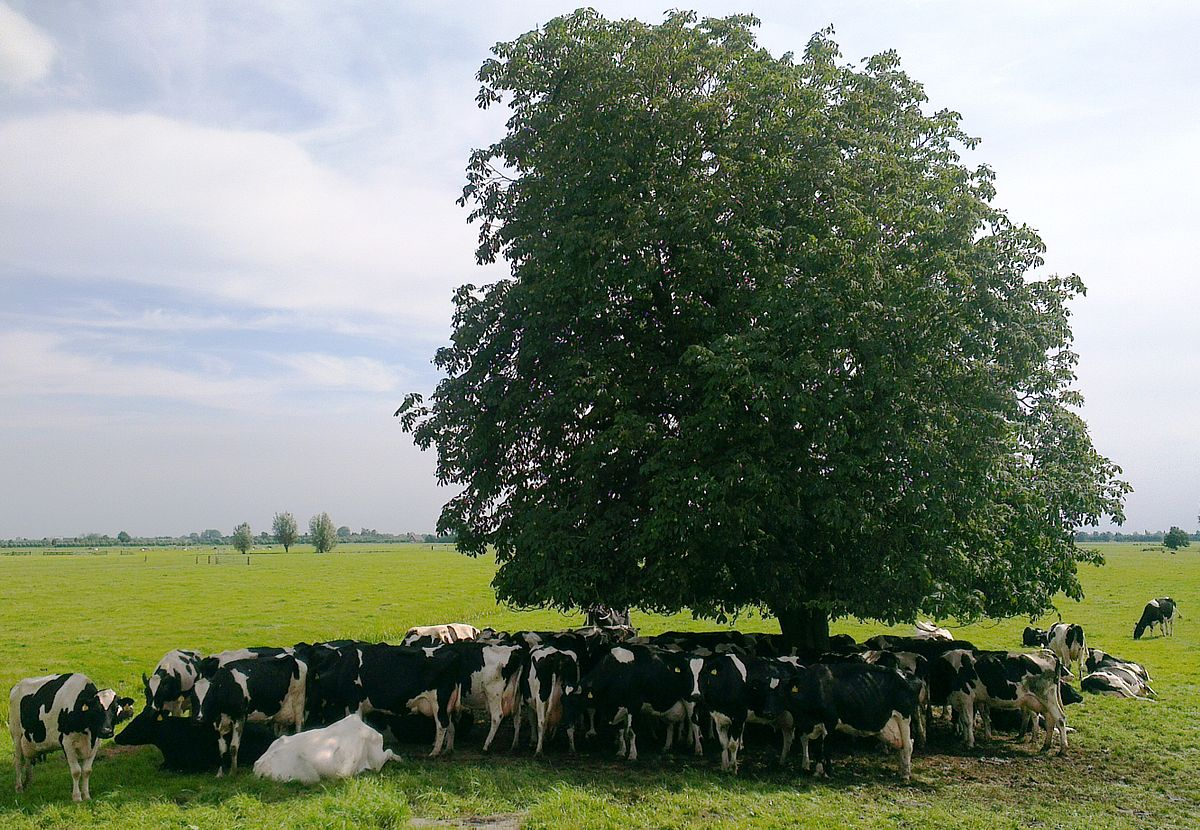
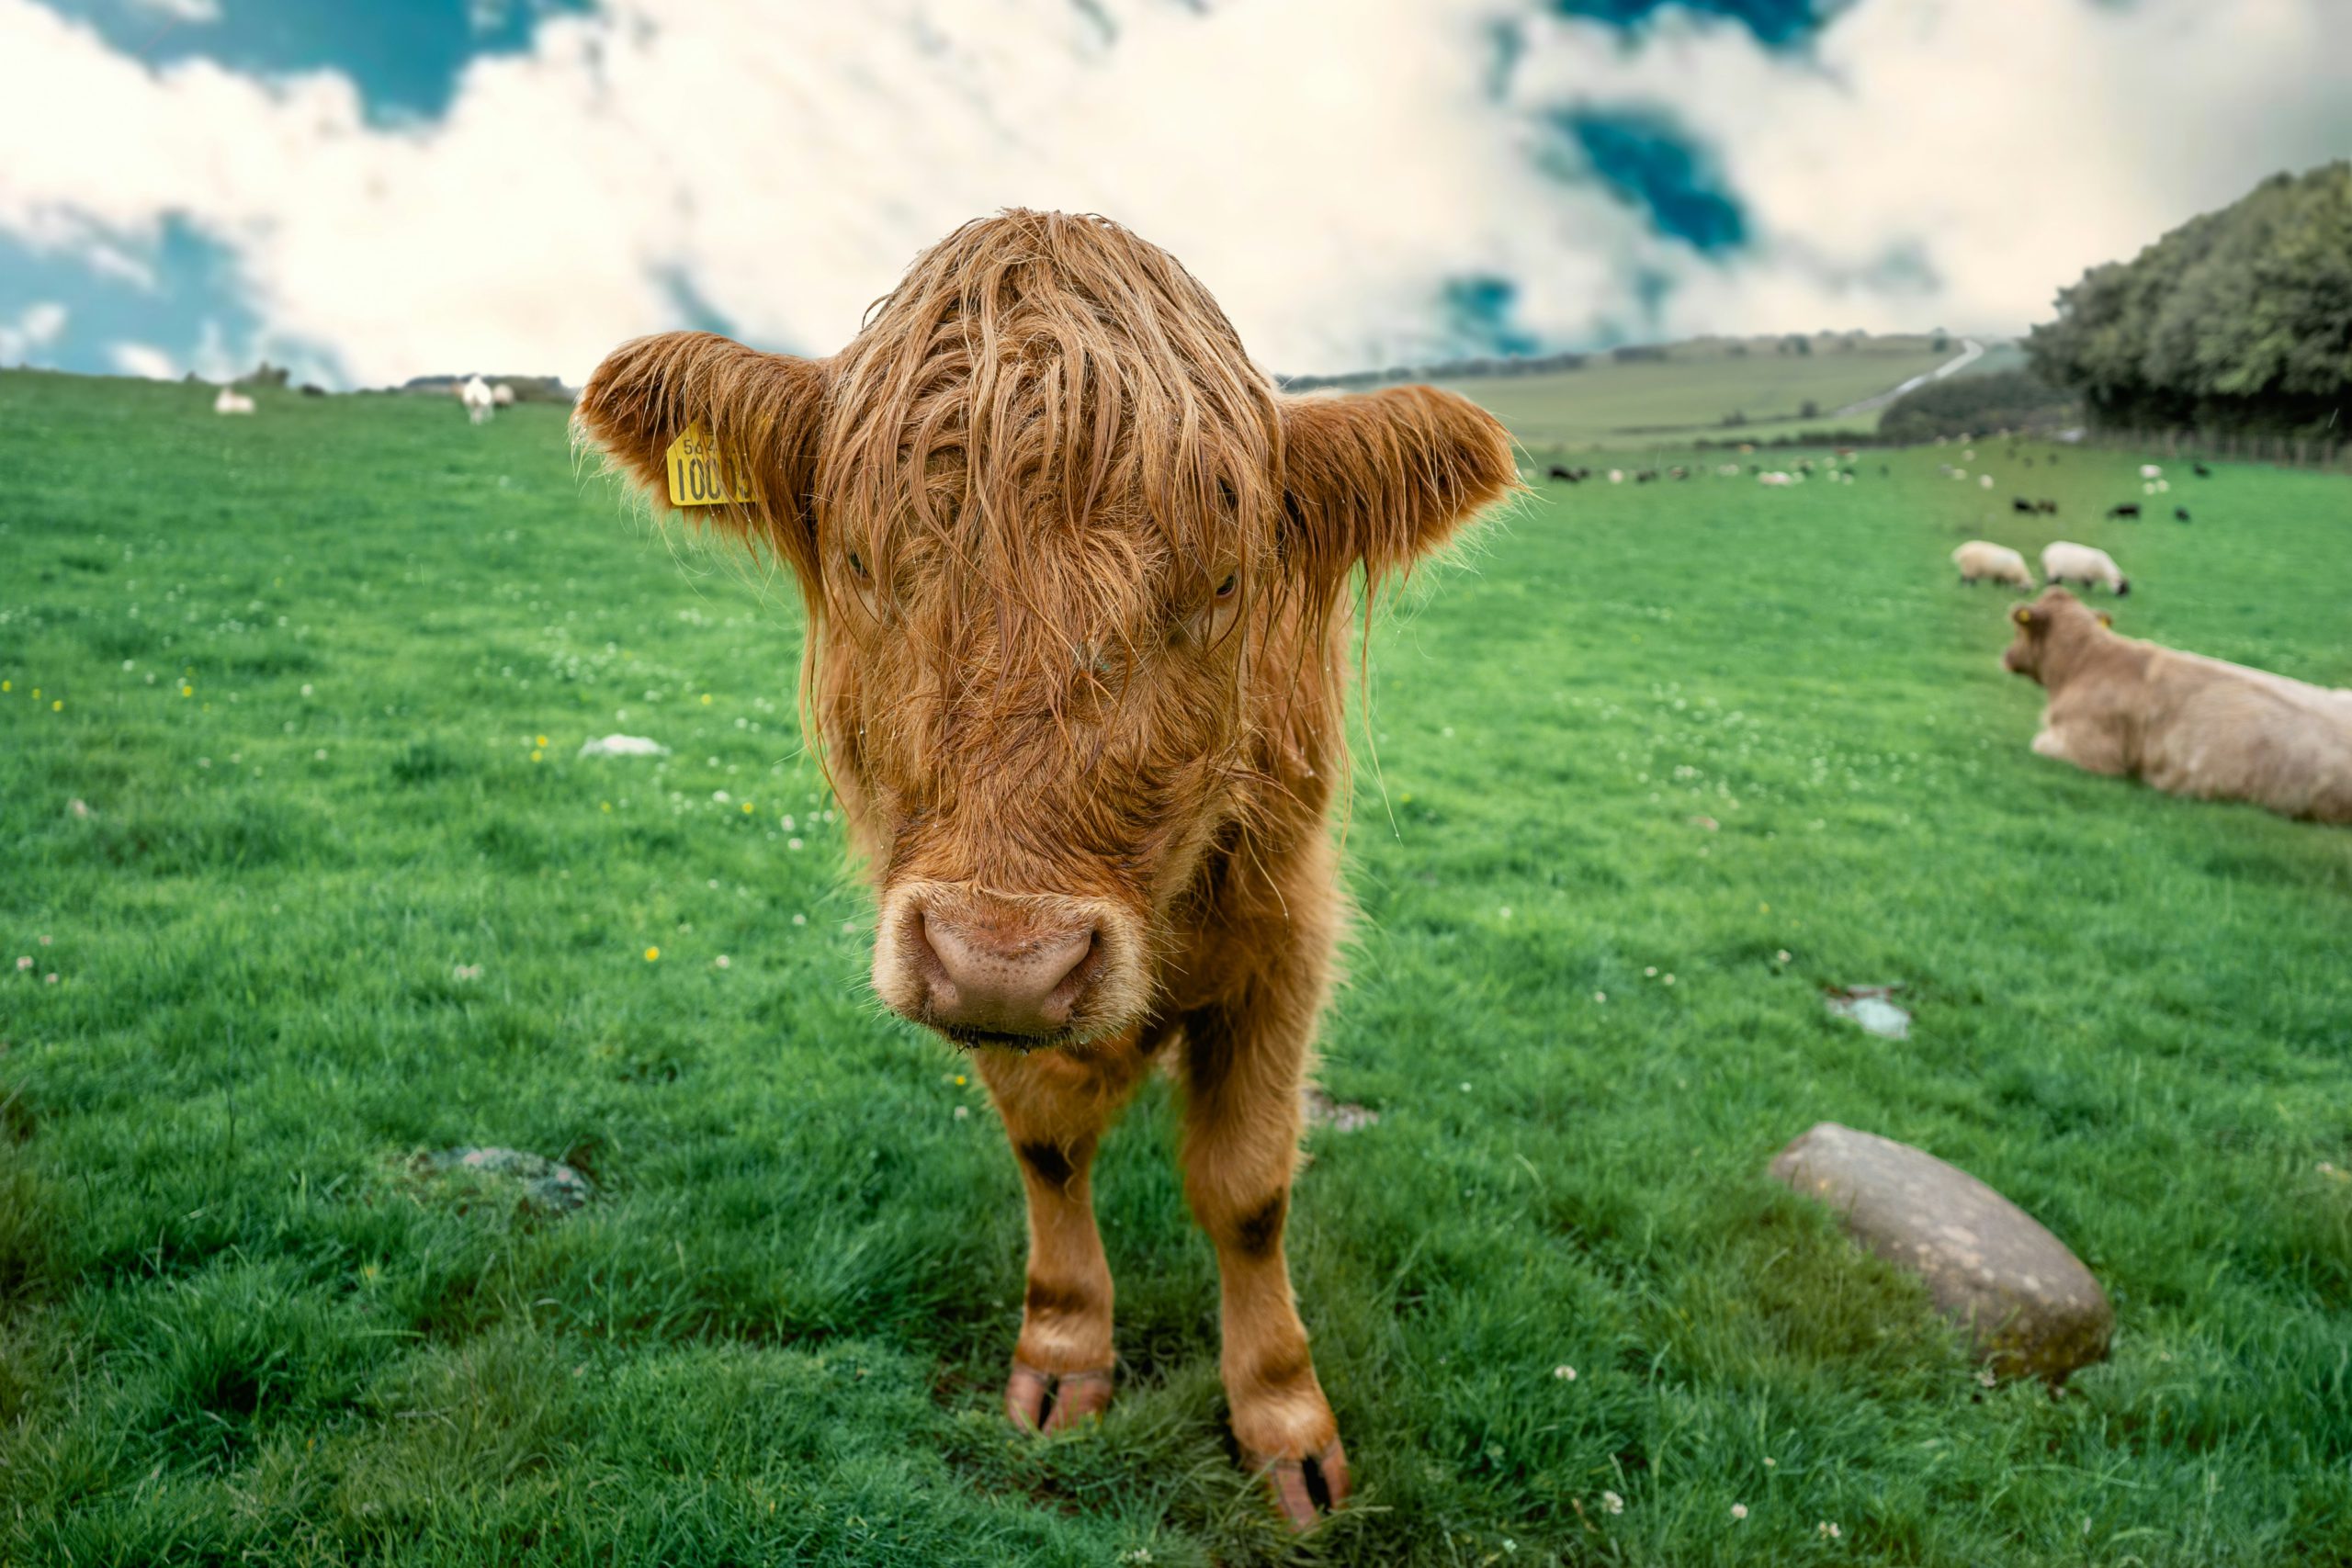
Cows finding any available shade on a hot day
Some solutions
Allowing a tree to grow tall in an existing hedge, or planting trees in a hedge to ‘gap up’ is a simple start, but adding in-field trees to pastures brings even more benefits. For those farmers practising a form of paddock or mob grazing, it is very easy to end up with a grazing plot that only has one side hedged, offering no shelter at all.
There are a variety of options for introducing trees into pasture fields, and an increasing number of agroforestry advisors who can work with you to understand what will work for your farm system and the welfare of your animals. Despite the Sustainable Farming Incentive being paused, you can still produce an Agroforestry Plan for your holding for which you will be paid £1,268. This makes me optimistic that tree planting and management will be funded when the financial support options are opened again next year. It’s also worth knowing that you can plant up to 275 trees per 0.25 hectares without changing the classification of your land.
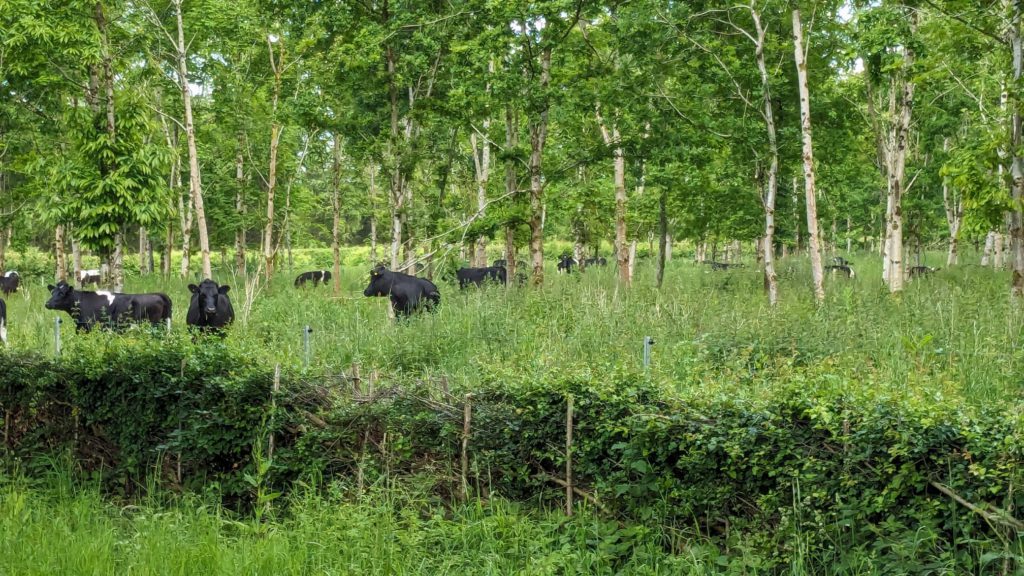
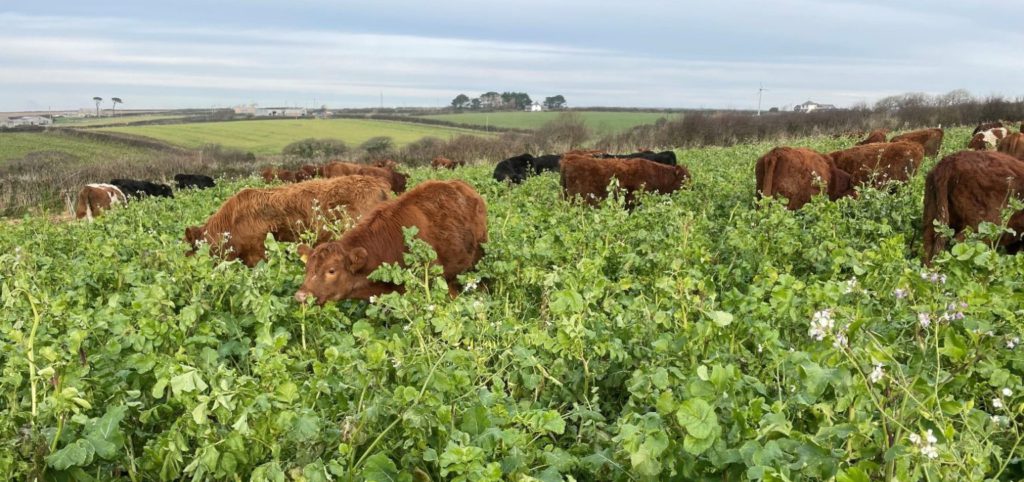
Cows grazing in woodland
Given that the best time to plant a tree was yesterday, now is a good time to hatch a plan for autumn/ winter planting. You don’t have to wait for the Government to fund this for you. Whilst larger plantings may need some capital assistance, a few trees and some simple protection may be cheaper than you think. Your future bottom line will thank you for it, as will the cows who give you the milk to make that ‘very necessary’ ice-cream…
There is a growing interest in biomass crop cultivation in the UK to provide materials for biobased products and to offer environmental protection benefits. Biobased materials offer an alternative to single use plastics, construction materials derived from fossil fuels and can replace peat with home grown wood fibre from fast growing perennial crops. In collaboration with AFBI, Crops for Energy, Calvium, and supported by funding from the Centre for High Carbon Capture Cropping (CHCx3), we investigated the greenhouse gas (GHG) emissions associated with growing various biomass crops in the UK compared with arable and livestock farming.
The emissions calculations will be provided on the Envirocrops platform, whose development has been funded by DESNZ, to aid farmers in decision-making when considering switching part of their land into biomass crop cultivation.
We provided two arable and six livestock farming scenarios to compare with the cultivation of six different biomass crops and modelled the associated emissions using the farm carbon calculator (see Table 1). As some of the biomass crops have a long lifespan (10 – 25 years) with the potential for multiple harvests from one planting, the emissions for each farming scenario were modelled over a 20 year period.
The biomass crops included in the project were short rotation coppice (SRC) willow, SRC poplar, miscanthus, switchgrass, reed canary grass and hemp. As hemp is an annual crop, it was swapped in for a crop in the arable 3 or 5-year baseline rotations. For the other biomass crops, two scenarios were modelled, either conversion from arable land or conversion from grassland, which differed in their field preparation operations and herbicide application, to provide the comparison to the arable or livestock grazing scenarios respectively.
Only associated emissions from the different farming practices were modelled but no potential carbon sequestration due to the high level of uncertainty and lack of current available research (particularly with biomass crops grown in the UK). Additionally, any emissions or sequestration from carbon stock changes in soils were not modelled, as this would vary largely depending on a variety of factors (e.g. location, soil type, season). Emissions were modelled to farm gate and do not include the downstream processing of crops. To see a more detailed outline of the data that went into the GHG calculations, visit our assumptions document here.
Table 1. The farming scenarios and their modelled emissions.
Scenario
Emissions taken into account
Arable
3-year baseline rotation
Rotation: Winter Wheat, Spring Barley, OSR
Crop residues left in the field
Fertilisers
Sprays and associated water usage
Red diesel usage from field operations
5-year baseline rotation
Rotation: Winter Wheat, Spring Barley, OSR, Field Beans, Winter Wheat
Crop residues left in the field
Fertilisers
Sprays and associated water usage
Red diesel usage from field operations
Livestock
No input grazing cattle
Number of beef livestock (1.2 head/ha or GLU 0.9/ha)
Red diesel use
Low-input grazing cattle
Number of beef livestock (1.2 head/ha or GLU 0.9/ha)
Red diesel use
Fertiliser inputs (low)
High-input grazing cattle
Number of beef livestock (1.6 head/ha or GLU 1.2/ha)
Red diesel use
Fertiliser inputs (high)
High-input silage cattle
Number of beef livestock (2 head/ha or GLU 1.5/ha)
Red diesel use
Fertiliser inputs (high)
Silage crop residues
No input grazing sheep
Number of ewe livestock (11.25 head/ha or GLU 0.9/ha)
Red diesel use
Low-input grazing sheep
Number of ewe livestock (11.25 head/ha or GLU 0.9/ha)
Red diesel use
Fertiliser inputs (low)
Biomass crops
Hemp (conversion from Arable land)
Swapped in for OSR in 3 and 5-year arable rotations
Crop residues left in the field
Fertilisers
Sprays and associated water usage
Red diesel usage from field operations
Miscanthus Switchgrass Reed Canary Grass SRC Willow SRC Poplar (conversion from arable and grassland)
Crop residues left in the field
Herbicides (field preparation and site restoration)
Red diesel usage from field operations
What we found
As biomass crops can be planted once, harvested repeatedly and require little to no fertiliser inputs over the 20-year period, the emissions associated with cultivating biomass crops are considerably lower than the arable and livestock farming scenarios.
Arable comparisons
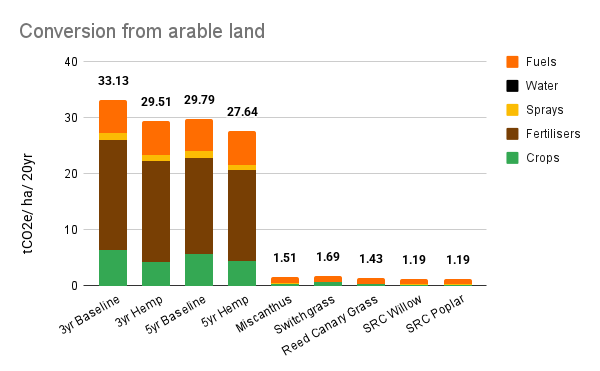
The biggest contributor to the arable scenario emissions is from fertilisers (see Figure 1). Swapping hemp into the rotations decreases emissions by an average of 9.2% when compared to the average of the 3 and 5-year baseline rotations.
For the perennial biomass crops, there is an average 95.5% decrease in tonnes of CO2e per hectare per 20-year period compared to the average of the arable baselines. This is largely because the perennial biomass crops do not require fertilisers, the application of sprays and fertilisers is often not possible once the crops are established due to their size. However, It is worth noting that soil testing and site choice are essential to help establish any nutrient requirements prior to biomass planting, which has not been included here due to its varying nature.
Additionally, because the rootstock of the perennial biomass crops remains viable for many years (excluding hemp), emissions associated with biomass crop residues are lower.
Figure 1. Total tonnes of CO2 equivalent per hectare per 20-year period (number above bar) for each arable farming scenario. Colours represent the emissions categories.
Livestock comparisons
Livestock comprise the largest proportion of emissions in the grassland grazing scenarios (see Figure 2), which is associated with enteric methane production and manure emissions. There is a potential average 97.6% reduction in emissions when switching to biomass crop production (per hectare, per 20-year period).
Figure 2. Total tonnes of CO2 equivalent per hectare per 20-year period (number above bar) for the livestock scenarios. Colours represent the emissions categories.
Summary
From these example farming scenarios we can see that the emissions associated with cultivating biomass crops are substantially lower than arable and livestock farming. An increase in biomass cropping in the UK and Ireland has the potential to aid in the transition towards net zero goals, along with diversifying farming portfolios and income streams. Biomass crops can often grow on marginal land that may otherwise be unproductive. They can also be incorporated into food production systems, for example, SRC and short rotation forestry (SRF) tree crops can be planted as agroforestry silvopasture or silvoarable systems, to offer increased biodiversity in farming systems. As part of this project we were able to research and include additional biomass crop emissions factors in the Farm Carbon Calculator, contributing to our project aims on the CHCx3 project.
To accurately estimate the emissions and sequestration from your beef enterprise, you will need to add data to the following sections of the Calculator:
When setting up the report, make sure you enter the area of grazing (grassland) as well as any non-agricultural land area and cultivated land (arable or horticultural)
Use the Livestock section and select beef cattle. Add as many entries as you need to cover your herd. For example, you may have two groups of steers with different liveweights or kept on the farm for different lengths of time. In which case, enter the steers from the first group with one liveweight and then the steers from the second group as a separate entry with their own liveweight. This will give you more accurate emissions from their enteric fermentation (gut methane).
To calculate the average head of livestock on the farm over a 12 month period, take the number in a particular livestock category per month (so you have 12 “snapshots”) add these together and then divide by 12. Our data collection sheet has a help sheet for this. For growing animals, you may want to use the same approach for calculating average liveweight (our defaults assume a midpoint liveweight through the year for growing cattle but growth rates won’t be linear so using the snapshot approach may be more accurate)
Livestock entries also capture the CO2 equivalent (CO2e) of the methane emissions from enteric fermentation and of the nitrous oxide (N2O) emissions from the animals’ manure over the course of the year. The Calculator asks you how this manure is managed as this has an impact on the N2O emissions
You have the option to input the average dry matter intake (DMI)per animal per day (kgDM/head/day). The DMI can be used to more accurately calculate the enteric emissions of the cattle, and if left blank, a simpler algorithm will be used that does not consider DMI
You will need to account for any supplemental feeding via the Livestock > Animal feeds option – this is for brought-in feeds that were produced off-farm
Account for all your fuel use, electricity use, consumables, inventory items and waste produced using the relevant sections (Fuels, Materials, Inventory, Waste). However, if you also have a dairy herd or arable operation, you may prefer to create a separate report and use this as an Overheads report to apportion shared capital items and energy usage emissions between your enterprises. Watch our video to see how this works in practice.
We recommend getting your soil sampled and have a guide on how to do this effectively and affordably. By monitoring your soil organic matter or soil organic carbon over time you can begin to log sequestration rates in your grazed (or other) soils. Once you have two years’ worth of soil sample results, you can enter these in the Calculator under Sequestration > Soil Organic Matter (you will also need bulk density measurements and a record of the depth of the sample).
If you don’t have directly sampled soil data for all your soils, you can use our range of proxy values for different Countryside Stewardship and habitat classes to estimate how much carbon your soils may be sequestering year-on-year. You can also measure the length of any hedgerows and field margins (ungrazed) and enter these to estimate the carbon sequestered in them on a yearly basis.
There is a growing concern about carbon “tunnel vision” in agriculture, where the sole focus is on reducing emissions without considering the bigger picture. Reducing emissions is crucial, yet it’s important to acknowledge that it is only one piece of the puzzle and focusing solely on carbon can neglect factors such as soil health, water quality, biodiversity and other issues such as pollution. There is also often concern from farmers about how the pressures to achieve net zero targets can impact profitability, especially when incentives to be net zero are limited or non-existent, and investments in the infrastructure and technology required to transition to low-carbon farming are high.
But this doesn’t have to be the case. We can use an understanding of a farm’s emissions to make informed decisions to change management practices that can lead directly to both reduced emissions and increased profitability, and we can point to an increased number of farmers who are doing just this.
Mike and Sam Roberts farm 435 acres at Blable Farm, of which a large proportion is down to herbal leys. After Sam returned to the farm in 2018 a decision was made to review the whole operation and, in conjunction with James Daniel of Precision Grazing, the decision was made to reduce the herd slightly from 180 to 150 cows, implement rotational grazing on diverse leys and to focus on reducing inputs and improving soil health.
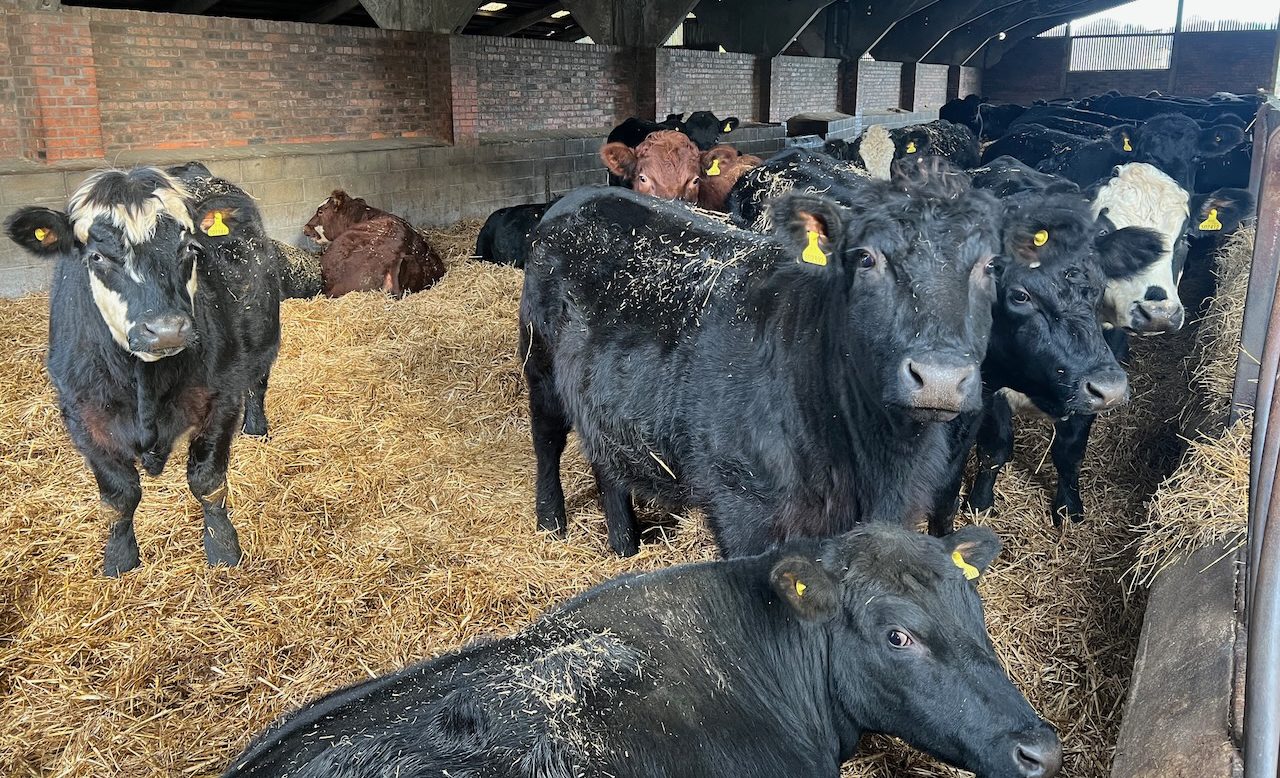
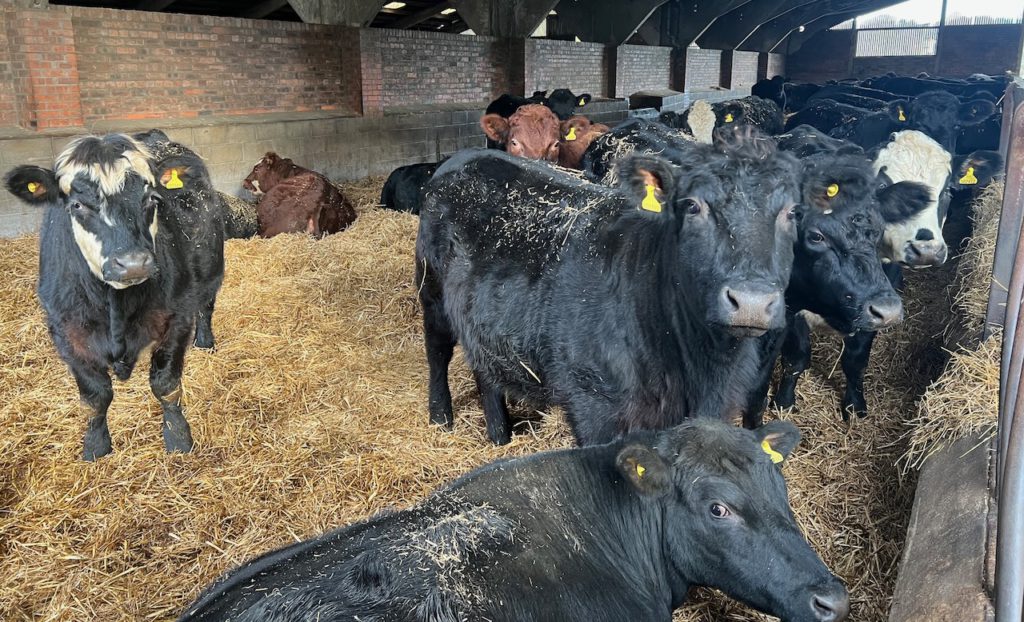
Cattle out wintering at Blable Farm
The effects were immediate and obvious. Soil health has seen a rapid improvement with better structure, increased earthworm numbers and soil organic matter is on the rise. The grazing period has been increased from 6 to 12 months and the farm hasn’t bought fertiliser since 2021, with none being used last year. Importantly, animal performance has increased in line with improved soil health and while cow numbers were reduced initially Mike and Sam are looking at increasing numbers again. All of this has seen a significant saving on input costs which has been re-invested into the business, including a full soil audit to better understand how soil health is improving. In line with reduced costs on-farm emissions have been reduced significantly with Mike confident the farm can reach net zero within 5 years, a commitment made as part of being a demo farm for the Farm Net Zero project.
Another example of a farmer using an understanding of their carbon footprint to drive down costs and improve profitability is Tom Burge of Oaremead Farm. Tom farms 760 acres of grassland on Exmoor and runs both a suckler herd and commercial sheep flock. In 2017 Tom began shifting to a more regenerative farming system which predominantly focussed on an improvement in grazing management, once again aided by James Daniel from Precision Grazing.
Over 5 years, Tom has completely cut out the use of artificial fertiliser and reduced his feed use by over 70%. This has been made possible by an increase in dry matter grown of 0.9 tDM/ha, through improved grazing management, and has reduced input costs by 50%, with a similar reduction in emissions from inputs, as shown in the chart below. Crucially the farm is now profitable before taking into account income from subsidies and environmental schemes. In the next 5 years, Tom plans to completely cut out bought-in feed and to have halved fuel use and, like Mike and Sam, be well on the road to net zero while remaining highly productive and profitable.
Oaremead Farm emissions from inputs
These are just two of an increasing number of examples that we are coming across as we work with more and more farmers who are using their carbon emissions as just one metric to help improve their farm businesses. And far from impacting just a farm’s emissions and bottom line, the management changes that are being implemented are having beneficial impacts on those ecosystem services mentioned previously, soil health, biodiversity, water quality and reduced pollution. Proof if ever it was needed of the potential for long-term sustainability within our farming systems.
Emissions from livestock cover two broad categories:
Enteric methane emissions (this is the methane produced by the animals digestion)
Greenhouse gas emissions from the manure and slurry produced by the animals.
When you enter a group of animals in the Farm Carbon Calculator e.g. 100 dairy cows, the Calculator will consider both enteric methane emissions and the nitrous oxide, ammonia and methane emissions associated with the manure or slurry those 100 dairy cows produce over the course of 1 year.
It is really important to enter the average number of animals in a category over the course of the year rather than the total number. For example, if you have 100 dairy calves on farm for only 6 months of the year, you should enter 50 dairy calves. Otherwise the Calculator will have to assume that all 100 calves are on farm for all 365 days of the year, which would overestimate the enteric methane production and the amount of manure produced.
Why do the emissions associated with livestock vary?
In the Farm Carbon Calculator, we ask users to tell us the number of livestock in a range of different livestock categories. The emissions produced by animals will vary based on:
Number of livestock (more animals means more emissions)
Liveweight of animals (larger animals tend to produce more manure)
Type of livestock (ruminants produce enteric methane, monogastrics don’t. Each type of animal has its own “rate of excretion” and different animals’ manures produce methane at different rates)
Pregnancy and lactation (pregnant or lactating cattle produce more enteric methane for their size)
Manure or slurry storage (rates of methane and nitrous oxide, emitted indirectly through leaching and ammonia volatilisation, vary depending on how the manure is stored and for how long)
Where manure/ slurry is spread (if manure is spread, the type of land it is spread on will affect the rate of indirect nitrous oxide emissions through leaching).
What about slurry covers, storage bags, slurry bugs etc… ?
We are actively working on incorporating a lot more options into the Farm Carbon Calculator to allow users to give more detail on their manure management practices. We plan to include options in 2024 for sending manure and slurry to anaerobic digestion, adding detail on slurry pit coverage, storage timing, and different application or incorporation methods for slurry (e.g. trailing shoe versus splash plate).
We are also researching the possibility of including slurry bugs (bacteria that inhibit greenhouse gas production from slurry stores) and chemical nitrous oxide inhibitors (that reduce the emission of greenhouse gases when the slurry is applied to the soil) as options so that users can show the benefits of these in reducing their slurry emissions. Similarly, we would like to be able to include methane inhibitors that can help to reduce enteric methane emissions for livestock.. To date though, the quality of independent scientific evidence for these management practices is very variable and different products show variable results depending on the farm environment, so it is harder for us to give robust estimates of the effect they will have on a farm’s emissions.
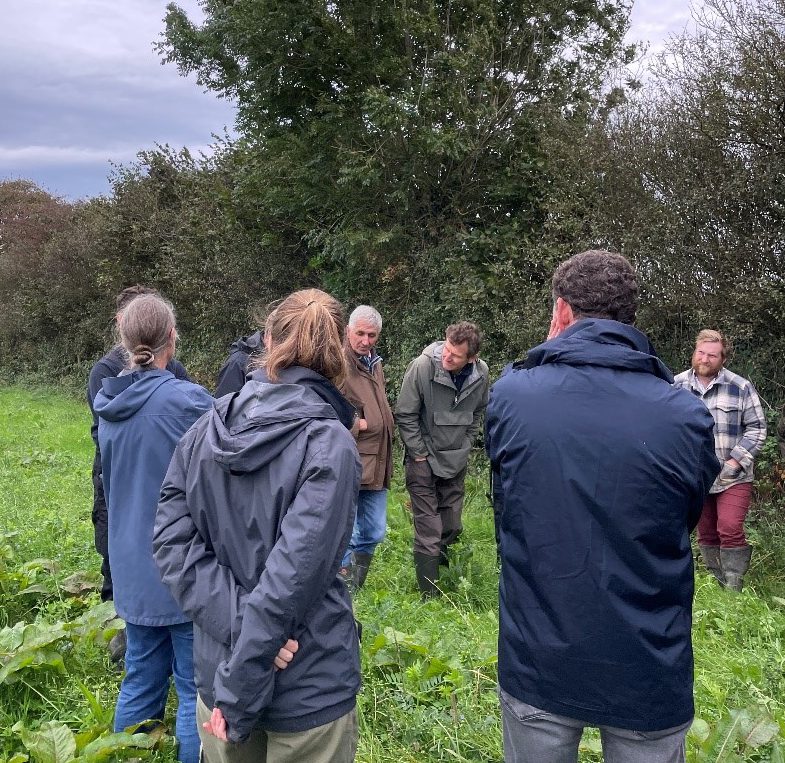
Farm Net Zero was pleased to host Dr. Lindsay Whistance from the Organic Research Centre. Lindsay specialises in animal behaviour and welfare and her talk presented results from a range of research studies on animals in agroforestry systems. This event was made possible with thanks to the National Lottery Community Fund who fund the Farm Net Zero project.
The talk was hosted by Demo Farmers, Mike and Sam Roberts, at Blable, Wadebridge. Mike and Sam spoke about the different motivations for tree planting, with Mike being interested in trees with a useful end value (having experience of growing a small fir plantation on the farm) and Sam wanting to learn more about the benefits that trees can provide to cattle daily liveweight gain in their rotational grazing system.
Firstly, Lindsay explained that good welfare is about maintaining homeostatic equilibrium – or balance, both physiological and emotional. Most of an animal’s daily behaviour is about trying to maintain that balance, and farming should aim to support this wherever possible.
Lindsay spoke about three main themes of animal behaviour and welfare in agroforestry systems. The first was temperature regulation; if animals are too hot or too cold, then they will spend energy on trying to reach a balance. Where there is access to trees, animals are able to reach that balance faster as the trees provide shade and shelter from wind and rain. This is particularly important as climate change brings greater extremes of weather.
The second theme was the feed value of browsing on trees. Leaves on a number of tree species have been analysed and found to contain high levels of micronutrients and trace elements. This can provide additional benefits to the animal’s diet.
Finally, Lindsay spoke about the calming effect trees have. There is evidence that animals in woodland have better social relationships with less fear and aggression.
Overall, if livestock are in good welfare then they are able to use energy for fulfilling their potential. This improves efficiency of livestock production, which has benefits economically and for the farm’s carbon footprint.
Key takeaways:
Most livestock species benefit from access to trees/woodland.
Incorporating trees into farming systems helps to reduce the carbon footprint.


Recent Comments