To accurately estimate the emissions and sequestration from your beef enterprise, you will need to add data to the following sections of the Calculator:
When setting up the report, make sure you enter the area of grazing (grassland) as well as any non-agricultural land area and cultivated land (arable or horticultural)
Use the Livestock section and select beef cattle. Add as many entries as you need to cover your herd. For example, you may have two groups of steers with different liveweights or kept on the farm for different lengths of time. In which case, enter the steers from the first group with one liveweight and then the steers from the second group as a separate entry with their own liveweight. This will give you more accurate emissions from their enteric fermentation (gut methane).
To calculate the average head of livestock on the farm over a 12 month period, take the number in a particular livestock category per month (so you have 12 “snapshots”) add these together and then divide by 12. Our data collection sheet has a help sheet for this. For growing animals, you may want to use the same approach for calculating average liveweight (our defaults assume a midpoint liveweight through the year for growing cattle but growth rates won’t be linear so using the snapshot approach may be more accurate)
Livestock entries also capture the CO2 equivalent (CO2e) of the methane emissions from enteric fermentation and of the nitrous oxide (N2O) emissions from the animals’ manure over the course of the year. The Calculator asks you how this manure is managed as this has an impact on the N2O emissions
You have the option to input the average dry matter intake (DMI)per animal per day (kgDM/head/day). The DMI can be used to more accurately calculate the enteric emissions of the cattle, and if left blank, a simpler algorithm will be used that does not consider DMI
You will need to account for any supplemental feeding via the Livestock > Animal feeds option – this is for brought-in feeds that were produced off-farm
Account for all your fuel use, electricity use, consumables, inventory items and waste produced using the relevant sections (Fuels, Materials, Inventory, Waste). However, if you also have a dairy herd or arable operation, you may prefer to create a separate report and use this as an Overheads report to apportion shared capital items and energy usage emissions between your enterprises. Watch our video to see how this works in practice.
We recommend getting your soil sampled and have a guide on how to do this effectively and affordably. By monitoring your soil organic matter or soil organic carbon over time you can begin to log sequestration rates in your grazed (or other) soils. Once you have two years’ worth of soil sample results, you can enter these in the Calculator under Sequestration > Soil Organic Matter (you will also need bulk density measurements and a record of the depth of the sample).
If you don’t have directly sampled soil data for all your soils, you can use our range of proxy values for different Countryside Stewardship and habitat classes to estimate how much carbon your soils may be sequestering year-on-year. You can also measure the length of any hedgerows and field margins (ungrazed) and enter these to estimate the carbon sequestered in them on a yearly basis.
Lizzy Parker, our Carbon Calculator Manager, graduated her PhD from the University of Sheffield on Monday 8th January. Her thesis was on the role of the arbuscular mycorrhizal symbiosis in the physiological and metabolomic drought response of barley (how symbiotic root fungi can alter the barley plants’ chemistry and whether this helps them survive droughts – although she found that it didn’t help all that much actually).
Chances are, if you’re interested in measuring the carbon footprint of your farm you know a bit about what my job entails. I’m here to support you and help more and more farmers measure the carbon footprint of their farm. Each day, I’m immersed in both the challenges and rewards of what this involves:
We get it – carbon footprinting a farm can be hard, every farm is different, time is short and sometimes we all face problems fitting the farm information we have into an online carbon calculator.
Rising to the challenge
Behind our calculator is an approachable team who benefit from a two-way process where we help you and the more we do this, the more we learn and can improve the calculator in the long term.
We put together online resources; we generate and record ideas which guide ongoing research into methodologies of calculating GHG emissions in agriculture; and we contribute to the development and testing of our software.
When we develop, and when we test – we’re looking to see if things are getting better – and since starting in April 2024 we’ve already seen some great improvements rolled out to the calculator. My role contributes toward this on an average day.
Starting the Day: Checking in with the users
The day kicks off with a review of support requests from users across the UK and farms around the world. Our users vary widely, from small family farms to large agricultural enterprises, and their technical needs are just as diverse. Questions cannot be predicted but range from understanding how to input specific data into the calculator to interpreting their carbon footprint results.
I love interacting with those farmers taking the important step of calculating a footprint. There are many reasons for doing this – and all are inspiring, so it is great to hear from those involved. By solving problems or helping guide users my small but crucial role builds our understanding of carbon data.
Mid-Morning: Developing resources for sustainable agriculture
A big part of my role is creating and updating online resources that help users maximize the calculator’s potential. I’ll work on developing these resources – which you can view in our FAQ’s, downloadable resources, instructional videos, or during training sessions.
We think many farmers work long hours and appreciate a well-organized, easy-to-navigate guide that helps self-starters make the most of the Calculator – we believe it should be possible to use the tool yourself and feel that satisfaction of having achieved something.
Afternoon: Finding a solution for businesses or environmental professionals
The afternoon usually involves working closely with our Calculator Manager and other team members to ensure the Farm Carbon Calculator continues to deliver for our professional and commercial users.
We rely on the legion of professionals, organisations, and partners who pay to use our software through licences, our excellent API, or in other ways to reach ever more farmers. Their fees support the work we do in all senses and this is clear in all our approaches to commercial work.
Staying informed in this area is critical for our relevance as the opportunities for us to help those working in carbon management and agricultural sustainability are constantly evolving.
With Lizzy Parker, Calculator Manager, at FCT’s Annual Field Day 2024
Wrapping up: Reflecting on progress and user feedback
Toward the end of the day, I might be reviewing feedback from users on recent updates or features, and discussions from the morning. Positive feedback is always motivating, and constructive suggestions are tracked to help us improve.
Without farmers and others working hard on their footprints and their sustainability I either wouldn’t have a job, or wouldn’t have the inspiration to know what to do next. With that in mind – throughout the day you can reach me at the end of the phone or on email – so give me a call.
If you are an agricultural professional or large organisation you may want to see the services available for you, book a demo with us, or let me know if you want to learn more. Everyone else using the tool – just get started, create an account, or get in touch. You can reach us Monday to Friday 9am to 5pm on [email protected]
The day-to-day responsibilities of a carbon calculator development officer are a little more sedentary than those of our farmers or my advisory colleagues, but the intricacies of the job mean my life is far from mundane.
My primary objective is to continuously work on refining and enhancing our carbon calculator, ensuring it remains an accurate, trusted, and invaluable tool for UK farmers.
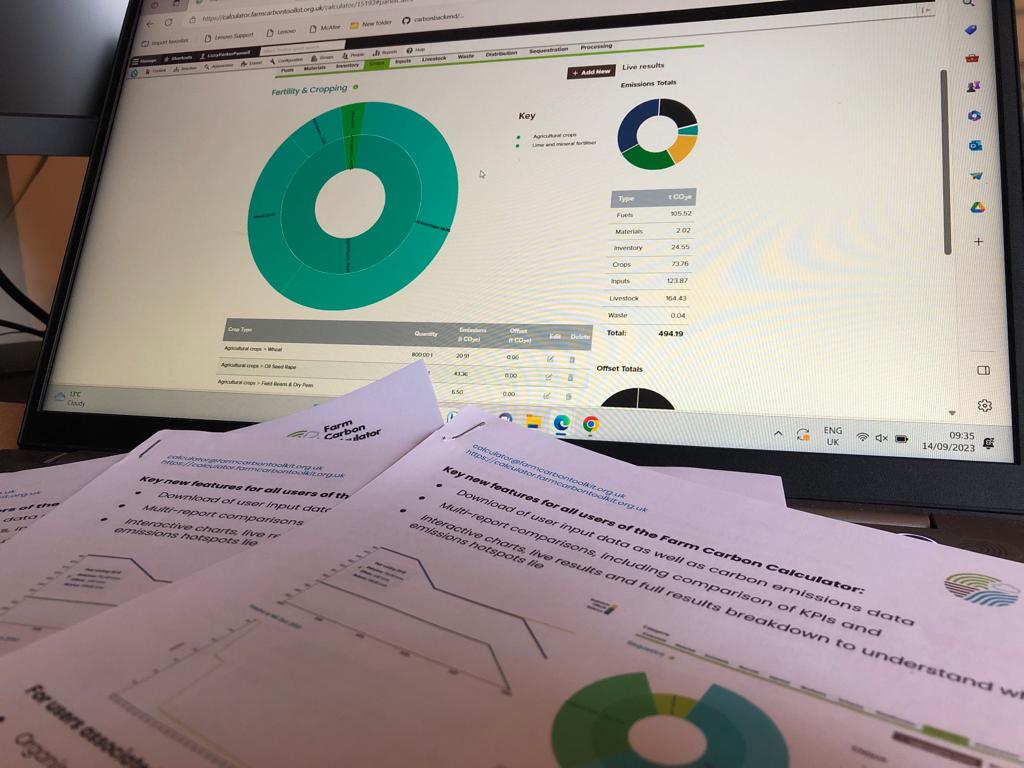
A significant portion of my time is dedicated to the core emissions factors that underpin the calculator. This can mean verifying or updating our existing factors, researching new factors, or addressing the requests from users and advisors about factors they want on the calculator. In the last couple months I have been working closely on the Version 1.6.0 update to the calculator, which required a comprehensive review of all the emissions factors we use. This was a formidable task, and I have spent countless hours scouring through spreadsheets, deep in research papers, and having lively video calls with the team and our software developers. For all this work we have been able to add great functionality to the calculator and made really exciting plans for what is in the pipeline (no spoilers!), so the toil has paid off and I am very satisfied with the extent of new data and functionality we have been able to add in such a short window of time.
Since starting with FCT in December 2023, I have also been fortunate enough to help in the creation of the Equine Carbon Calculator, an industry-leading initiative aimed at quantifying emissions from the equine sector. During this development process you could have found me doing a myriad of tasks, from researching how the emissions would vary between different horse breeds, to calculating the materials needed for stable buildings and their embedded emissions, or beta-testing the new website and calculator. The opportunity to be involved with the Equine Carbon Calculator was fantastic and I have been thrilled to see how many reports have been built in it since it went live in March 2024.
The enthusiasm and passion FCT and its community have for sustainable agriculture is inspiring, and as a new member of the company I have never felt so welcome and excited about a new job. I hope that my work with the calculator team will create an efficient and effective tool for you all, and with that I am going to dive back into the research papers!
Being Chief Exec of the Farm Carbon Toolkit is a privilege. I have a team of committed, enthusiastic and supremely knowledgeable people working with me who are dedicated to supporting farmers to understand their farm carbon footprint and to reduce greenhouse gas emissions and increase carbon sequestration, whilst maintaining thriving, biodiverse businesses.
We are a relatively small organisation, but I always love it when people tell me that they keep coming across the team as this means we are being noticed and, even more importantly, that people like what we are doing. Last week was just such an example. We were involved in a number of sessions at the Oxford Farming Conference including showcasing Farm Net Zero Cornwall and the great strides farmers involved in the group are making towards Net Zero. We also featured in the premiere of the film “Six Inches of Soil” and were mentioned by a number of other speakers at the conference whom we work with.
There is no such thing as a typical day for me.
I do start off with a list of what I would like to get done during the day and highlight the tasks which are important/ urgent, but then things happen, such as people making contact with me to discuss exciting new activities with which we could get involved. It is just about impossible to know which opportunities are the best to take forward from the great number which come our way every day, but my watch word is to pursue working with like-minded organisations whose first instinct is to think about what they can do to support reducing the greenhouse gas emissions from agriculture and who, like us, believe that farmers are supremely well-placed to remove carbon from the atmosphere through how they farm.
Over the last few months I have been developing relationships with other popular Carbon Calculators to enable us to work together where possible to harmonise Calculator methodologies, so that farmers’ Carbon Calculator results will be more comparable in future. This, I believe, will increase the uptake of their use. We know that the requirement to provide information on farm emissions and removals will increase over time and we are committed to continually improving our Calculator so that farmers who are taking action to reduce their carbon footprint can see this fully reflected in their reporting. We are also committed to providing our Calculator directly to farmers for free.
Our role in helping to decarbonise agriculture brings many challenges, not least making sure that our underlying data and methodology are the best they can be, aligning with the latest science. We’re always striving to improve this, which is why, every year, we conduct an independent review of our Calculator to ensure we’re giving the most robust agricultural carbon footprints possible.
This year, the review of our Calculator methodology was conducted by the Carbon Trust and we’re pleased to be able to share their findings and keep our users updated as we update the Calculator in response.
Summary of the Carbon Trust Calculator Review
In October 2023, The Carbon Trust conducted an independent review and gap analysis of the Farm Carbon Calculator against:
The GHG Protocol standard (GHG Protocol);
The WRI Land-Use Change and Removals Draft Guidance (WRI LSRG);
SBTi Forest Land and Agriculture Guidance (SBTi FLAG)
The following aspects of the Farm Carbon Calculator were covered by the review:
User interface
Quality Control procedures
Emissions factors
Calculation methodologies
Approach to land-use change
The review identified several strengths and areas for improvement to support the alignment of the tool with the above standards and guidance.
The Carbon Trust has received a detailed action plan of how FCT will enact these recommendations over the next 12 months (with the majority of improvements scheduled for release in April 2024). The Carbon Trust considers that the action plan addresses the points raised in the review.
This January I was very fortunate to attend the 27th Challenge in Rural Leadership course, run by the Worshipful Company of Farmers and Duchy College, with my place supported by the Henry Plumb Foundation and FCT. Throughout the course, I was able to work alongside other industry leaders, understand why they succeed and practically improve my expertise. However, it was also very clear that leadership is not inherited through attaining a particular job title or level of responsibility. There were many insightful and poignant moments from the course, but one of my favourites was from Mary Quicke, of Quicke’s Cheese in Devon – “No one has ‘Spent a long time in the office’ on their grave”. So with that, what am I getting up to?
FCT operates on an incredibly diverse scale, whereby we have the great privilege of working with farmers and growers across all sectors and corners of the UK and beyond. This is brilliant and makes each day highly varied but does mean that many lists are made in a day of the tasks arising. Today for example started by packaging up soil samples heading for analysis from a wonderful project we have up in the Lake District (thank you West Cumbria Rivers Trust and the lovely farmers involved) looking at baselining the soil health and carbon status of the farms. This quickly proceeded into finalising proposals for upcoming projects with Lamb Weston and First Milk – two brilliant companies who although operating in different sectors (potatoes and milk production) are both passionate about producing sustainable food to the highest standard.
This week I am also participating in some filming for a project we have recently launched with the Royal Countryside Fund titled ‘Savings in Soil’. It is a brilliant project looking to help farmers measure and manage their grassland’s soil health to benefit future farm resilience. As ever, soil underpins a healthy and productive grassland system, capable of producing healthy pastures and livestock, which in turn supports a profitable farming system.
I am very lucky to facilitate the Soil Farmer of the Year competition, as such the day also bought liaison for this year’s application process. The competition aims to find and champion UK farmers who are engaged with and managing their soils to the benefit of their farming system and the wider environment. We are supported again this year by Hutchinsons and Cotswold Seeds, so again an opportunity to say thank you to their teams!
So, despite a little bit of time in the office today – we have managed to work with a huge variety of topics and geographies, continuing to assist the fabulous farmers, communities and industries of UK agriculture.
One of the wonderful things about working for FCT is that no two days are the same. I am incredibly lucky that I get to work with such a brilliant group of colleagues and some fantastic farmers. Everyone brings new skills, knowledge and interests, which allow us to learn from each other and share ideas which is really rewarding.
This week has been an interesting week. I am currently delivering a new course which is being run by the University of Cumbria entitled Upland Farming for Net Zero. We have a great cohort of 15 students who are either directly farming or involved in supporting our upland farmers in the South West. This week, we have had online sessions focussing on storing more carbon in upland environments and measuring emissions from livestock, alongside a farm visit on Monday to discuss what it all means in practice. What’s great about this course is that it also feeds into a project we are just completing, which has built a version of the carbon calculator specifically for upland farmers to be able to take account of carbon on-commons, which is a welcome step forward.
I have also run a couple of training sessions for groups within the Royal Countryside Fund, providing an introduction to managing carbon on the farm. Although I do a lot of these types of talks, they never get boring as each session yields a different set of questions. What I get most enjoyment from is the interaction with the farmers and helping them to see how what I’m saying could be put into practice. It’s so rewarding to be able to help in some small way, even if it is just to help empower them to feel part of delivering the solutions.
Alongside talks, I have been finishing off a couple of reports for projects that are coming to an end: a dairy footprinting project combining farm footprints for the supplier farms with the operational footprint of the processing site, and writing some factsheets for farmers around the importance of managing manures and the opportunities with cultivation. There is always more to do and new projects and ideas to explore.
Understanding the carbon dynamics of peatland is a complicated process that is ever-changing for land managers and farmers. Historically, peat soils and habitats have been understood as a carbon store, with peat itself being of extremely high carbon content. However, in the process of carbon footprinting it is required to understand all greenhouse gases associated with peatland (carbon dioxide, methane and nitrous oxide) and the additional storage of carbon into these soils, a process known as sequestration.
Sequestration is the process of capturing carbon from the air and storing it within the land, through the process of photosynthesis. Within peatland soils there are additional layers of complexity when thinking of carbon storage. The waterlogged conditions of peat soils allow decomposing plants to accumulate, storing the carbon in the form of peat; this means that not only is carbon captured and stored via photosynthesis, but that there are direct carbon additions from the plant structures themselves.
Consequently, measuring peatland within the Farm Carbon Calculator or any carbon calculator can be complex – knowledge in the scientific community alongside methods of accounting are rapidly developing. However, the following methods can be used:
Direct Measurement: soil sampling the peatland soil to understand the carbon content (Soil Organic Matter or Soil Organic Carbon testing) provides a figure of the carbon stock within an area. Carbon stock is the quantity of soil contained within a soil at the time of measurement and is calculated in combination with a Bulk Density sample. To understand if your peatland is sequestering carbon (capturing more, additional carbon) this sampling needs to be repeated to understand whether the figure measured in the first instance is increasing or decreasing. Soil sampling can be conducted annually, but there is often concern around carbon flux so the Farm Carbon Toolkit would usually recommend sampling every 3-5 years. More can be found out about how to sample soil in our free online guide to monitoring soil carbon on the FCT website here.
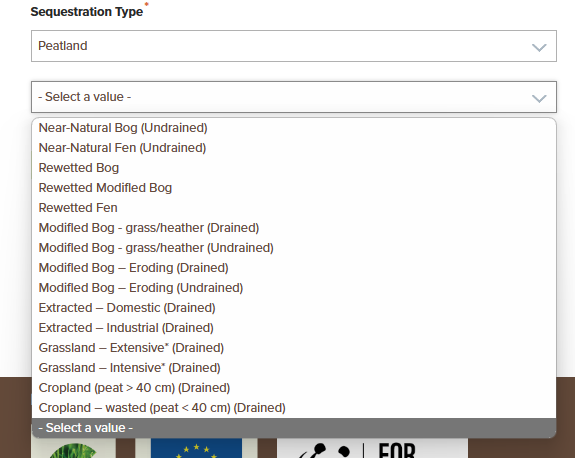
Modelled Measurement: if however direct measurement is unsuitable or you would like a faster indication of the carbon dynamics of your peatland soil you can use modelled figures embedded within the Farm Carbon Calculator. Using data from the Peatland Carbon Code 2.0 there is the ability to account for peatland areas of the landscape through selecting the type of peat you have and the area (hectares). The calculator will then provide a modelled suggestion of the likely dynamics of the different greenhouse gases associated with the different peat classifications.
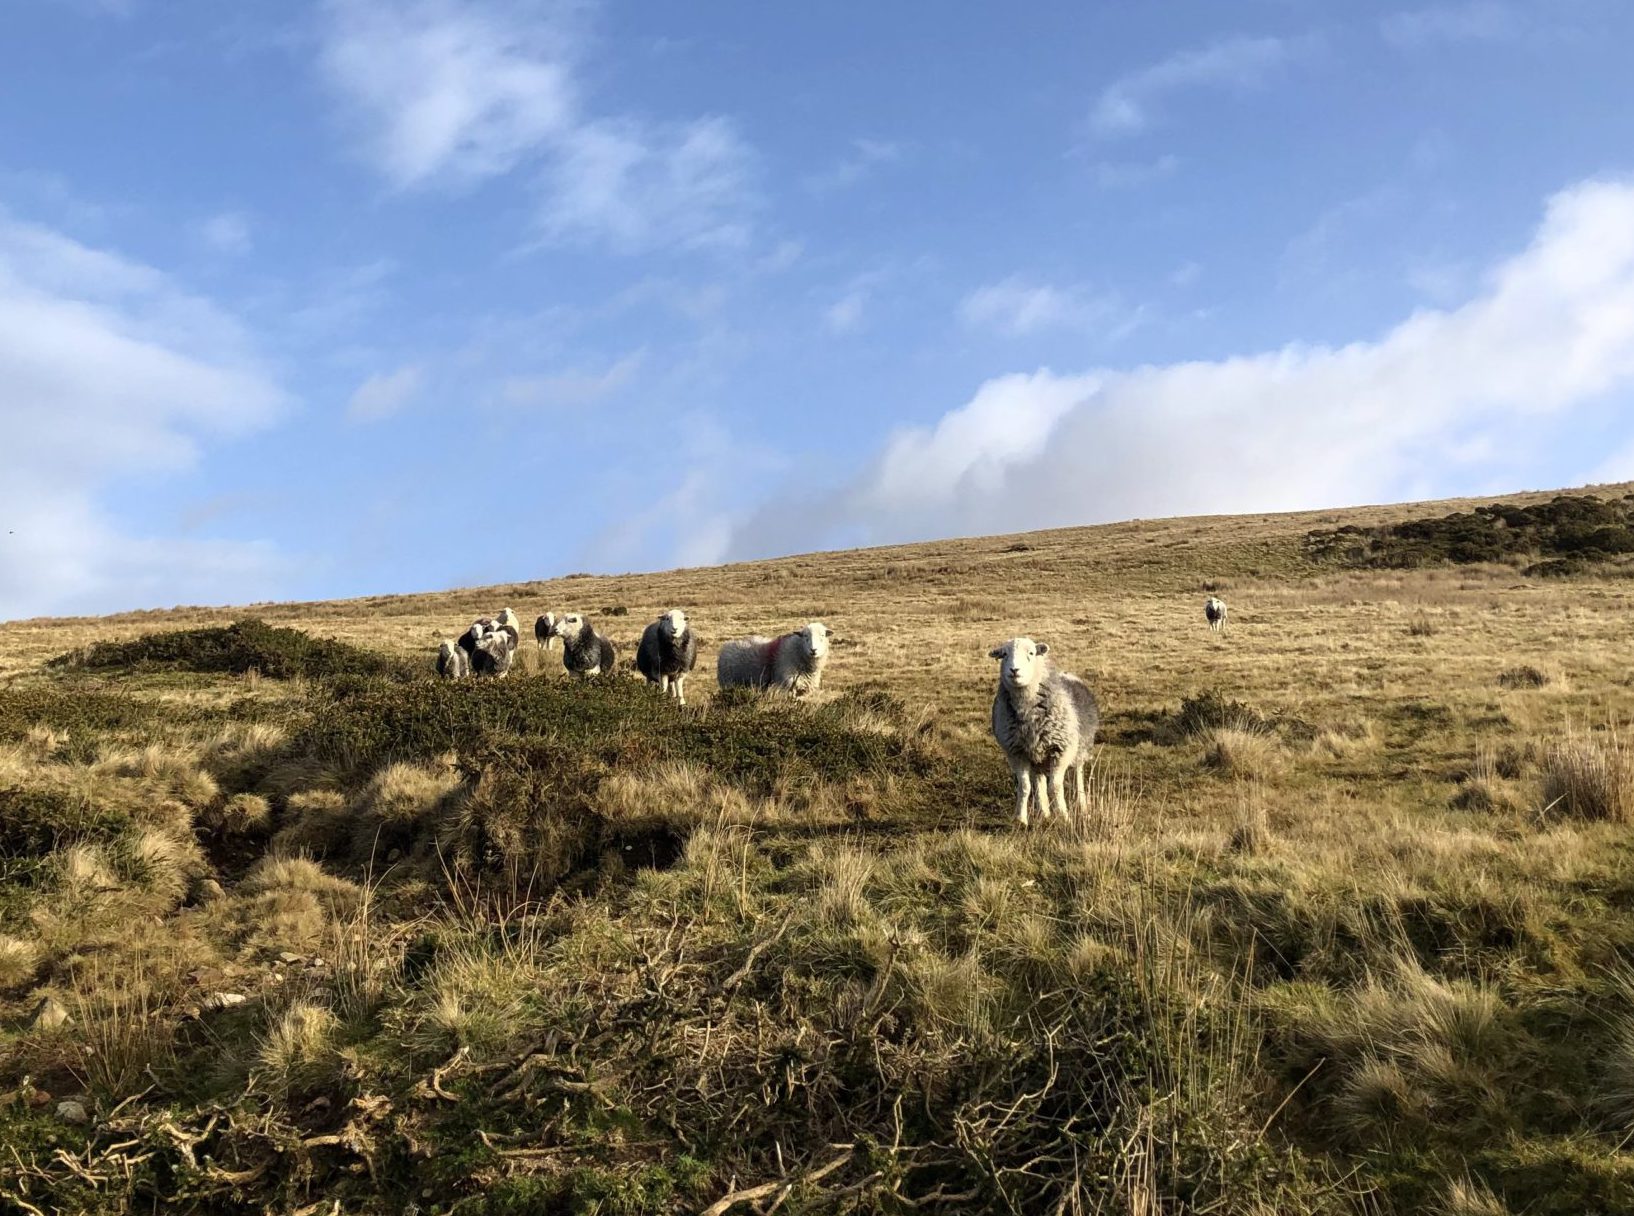
In December 2021, five farmers from the Fellfoot Forward Landscape Partnership participated in a carbon footprinting project in association with the Farm Carbon Toolkit. Based in proximity to the North Pennines AONB these five upland businesses demonstrated how livestock farming can work in conjunction with the wider landscape to produce quality food whilst providing environmental services such as water and air quality alongside carbon capture and storage.
A carbon footprint, or carbon balance, is the measure of the total emissions and total sequestration associated with a particular business or product. For this project, the whole farm was measured to include all of the enterprises included within a farming business. When we discuss ‘carbon’ we are referring to ‘CO2e’ or ‘carbon dioxide equivalent’ which is a measure of the three main greenhouse gases carbon dioxide, nitrous oxide and methane. Different greenhouse gases have different dynamics within the atmosphere, consequently having higher or lower warming potentials and thus potency as a contributor to climate change. Therefore, ‘carbon’ as a term encapsulates all three of these gases under one metric so we can compare items such as fuel alongside the biological systems seen in livestock like for like.
To produce a carbon footprint the farmers were asked to collect a variety of data associated with their business, including items such as fuel and water usage, livestock numbers and quantity of materials used for activities like silage wrapping or maintenance. Alongside these figures, it was also important to record the ‘natural capital’ of each farm holding – the resources found in the farmed environment which are managed as part of the business but provide wider ecosystem services and value – such as areas of woodland, length of hedgerows, soil organic matter and specific habitats such as floristically enhanced margins or wetlands. When all of these details had been recorded, the data was entered into the Farm Carbon Calculator to produce a carbon footprint detailing the balance of emissions and sequestration found at each farming business.
For the farms included in the project action plans were created to highlight where emission savings can be made or sequestration opportunities maximised. All of the farms within the project were found to be likely to be able to reach a Net Zero, if not already in this position. A large factor on many farms to reach this target is proper accounting of carbon held within the soil as organic matter. For the Fellfoot Farmers who are in majority grassland systems, livestock can be utilised as a tool to increase organic matter in soils – either through grazing systems and the capture of sunlight to be stored as carbon, or through the return of manure to pasture for nutrient cycling. To fully account for the potential sequestration of carbon through the building of organic matter in soils regular testing should be conducted to measure and monitor the levels found in soils. If, like on many farms there has been no prior soil organic matter testing the best advice would be to select three or four key fields within the farmed area which are representative of the systems within the business. For example, if the farm was in a grass-based system, a field which is usually cut for silage, one only grazed and a traditional low-input or hay meadow would demonstrate potential underlying trends in organic matter across the landscape. Equally, if there is a range of soil types or diversity of land use on a single farm it would be perhaps useful to test fields representative of these features to better understand trends and consequently the best management approach to conserve existing carbon and build stocks in the future. As ever, when testing soils aim to minimise external variation by ensuring consistency in the laboratory used and the time of year when sampling.
The project with the Fellfoot Forward farmers demonstrated the variety of approaches to upland livestock farming, from the number or type of stock to the management required to protect and enhance vulnerable habitats within their farmed area. Some of the farms included in the project had areas of peatland within their management, using cattle or sheep to maintain and conserve the landscape in association with government or local schemes to the benefit of the wildlife and ecology found there. Peatlands are a vast store of carbon and consequently, the condition of this landscape could greatly impact upon the land managers responsible for its status. More information is required to fully understand the dynamics of peat and how farmers can measure and monitor this landscape for not only carbon footprinting processes but also for generations to come.
Carbon footprinting is a process that can be repeated on an annual basis, used as a monitoring tool for both the emissions and sequestration of a farming business but also to understand changes in management approach. There is a general underlying correlation between high carbon and high cost on many farms, with items such as fertiliser and blended livestock feed being both expensive and also a comparatively larger contributor of emissions. Therefore, conducting a carbon footprint not only has benefits towards understanding the environmental impact of a business but also can be used as a tool for resource optimisation and economic efficiency.
Key findings
Conduct organic matter testing to understand the current carbon held within soils. Aim to repeat this testing every 3-5 years to understand whether your soils are sequestering (increasing in organic matter) or emitting (decreasing in organic matter) carbon.
Account for things you are already doing such as hedge or tree planting that are under existing or future schemes.
Accept that you may not have all the data, aim to create a baseline from which you can repeat the process in future years and account for more information with more experience, time or understanding.
Identify ‘hotspots’ where emissions are highest. Except for cropping or livestock, are there particular items or categories which contribute a larger proportion of emissions than others, is there potential for reduction in these areas?
Recent Comments